How to monitor
This process shows a sequence of actions that can be performed to monitor the system.
Check for alerts in Grafana
- Log in to Grafana (tile available in the admin portal)
- Go to Home > Alerting > Alert rules
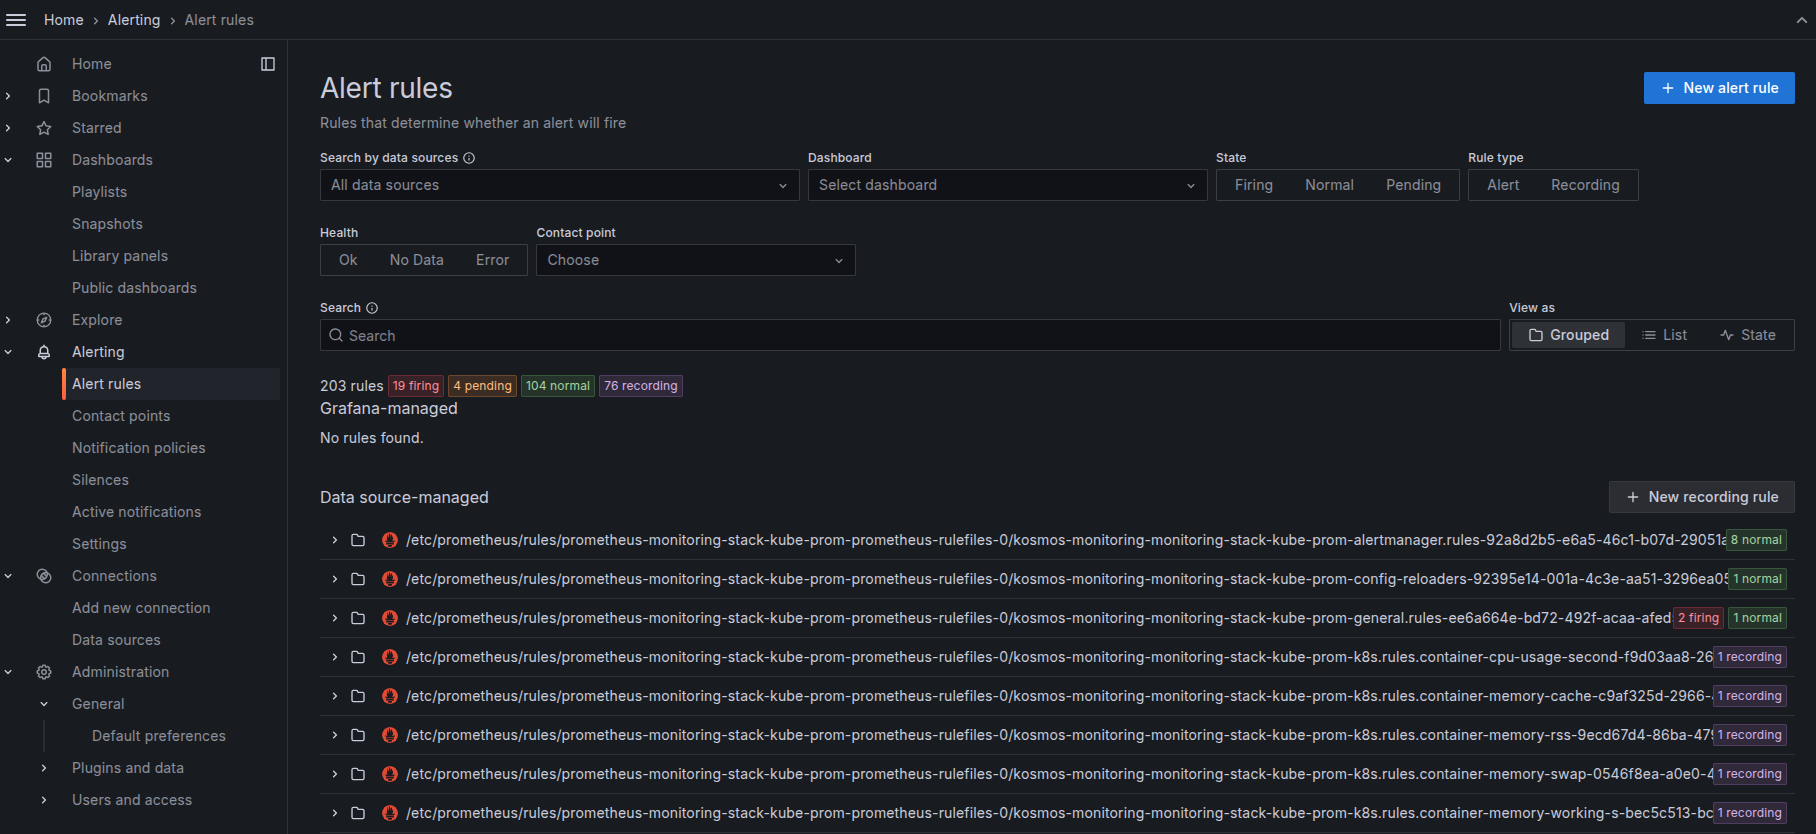
- It is possible to filter alerts according to their status ("Firing", "Normal", "Pending")
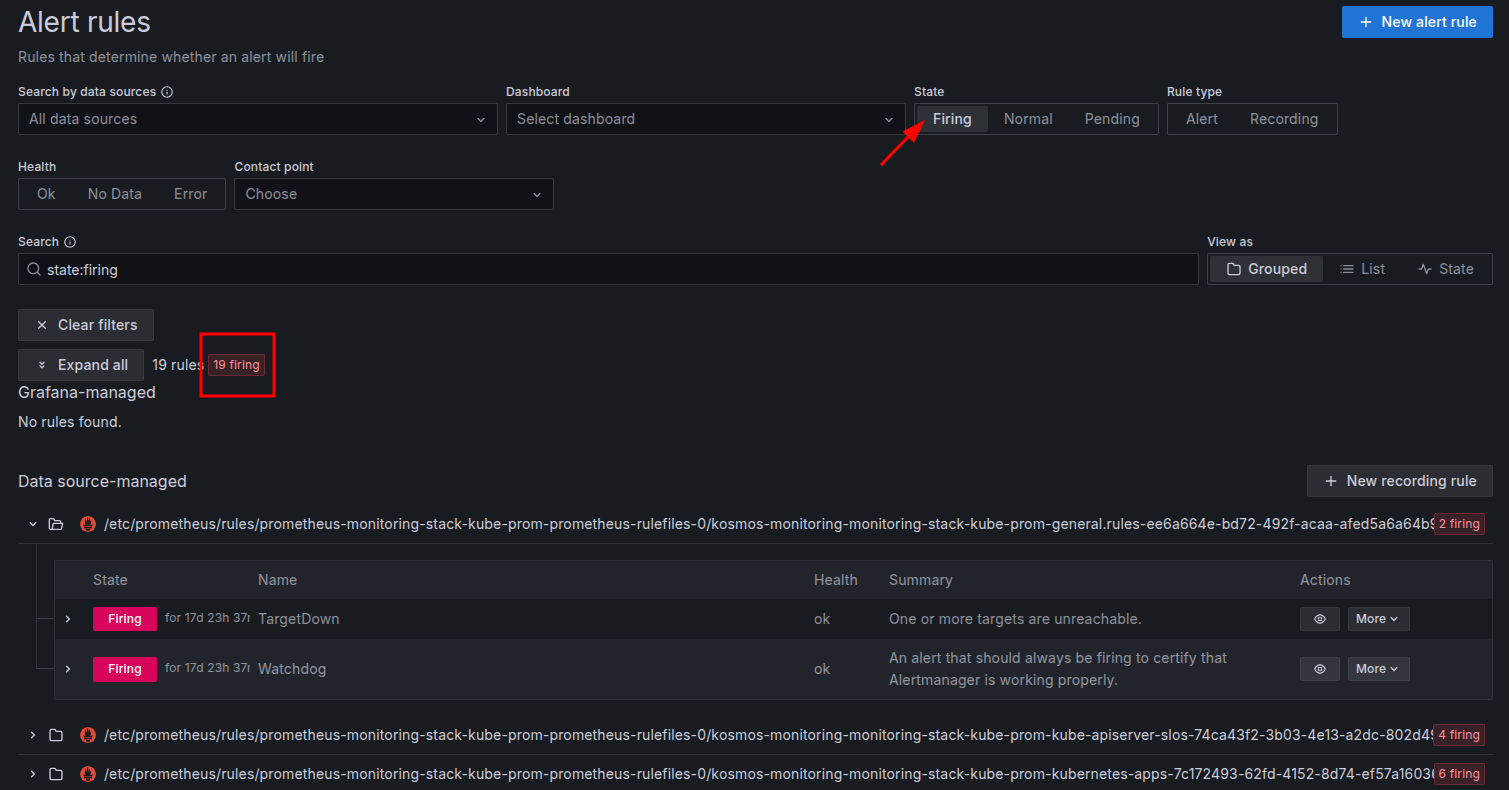
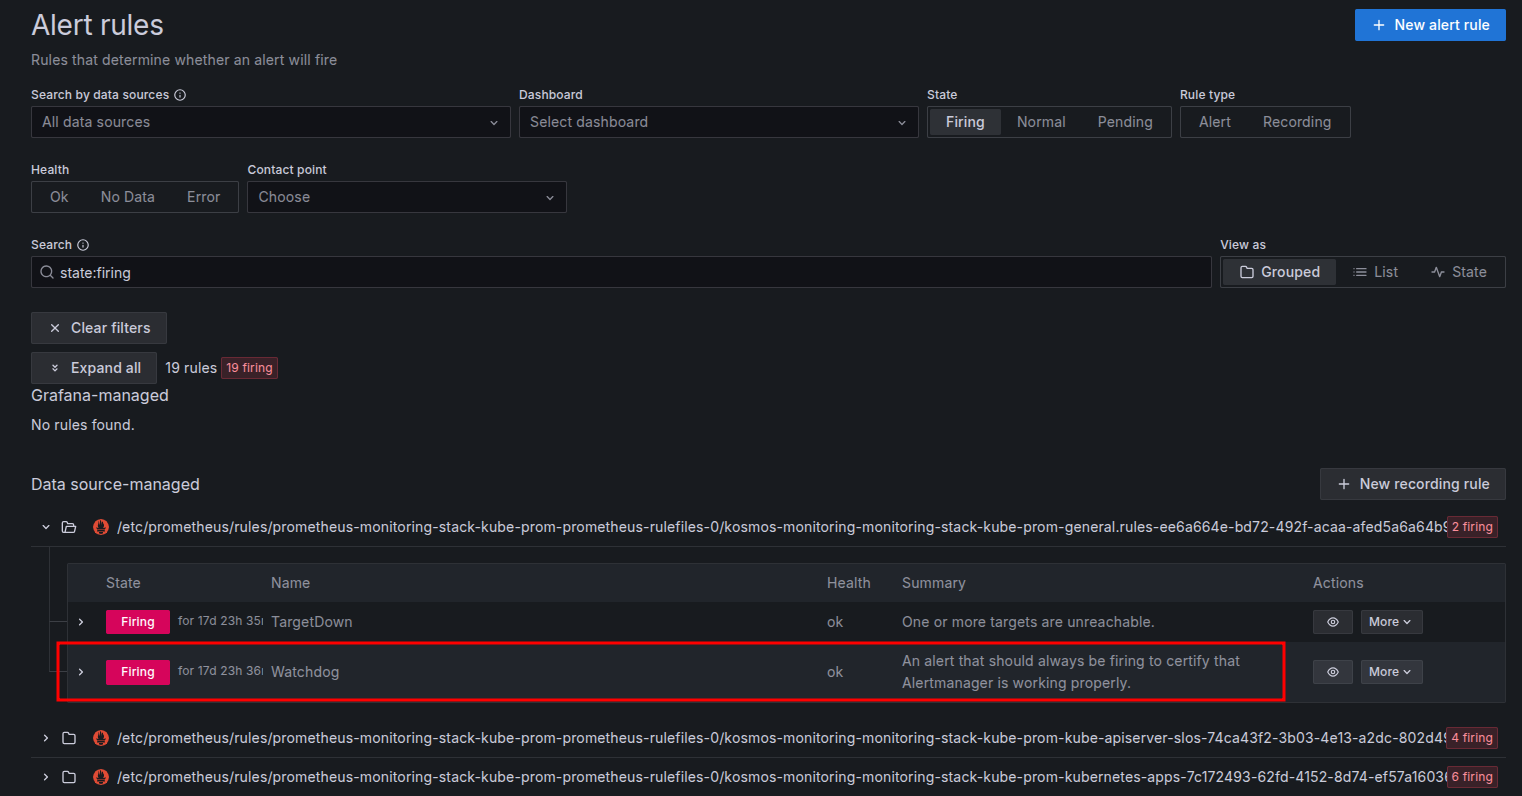
- An alert is always active to verify that the alarm system is working correctly; it is called Watchdog
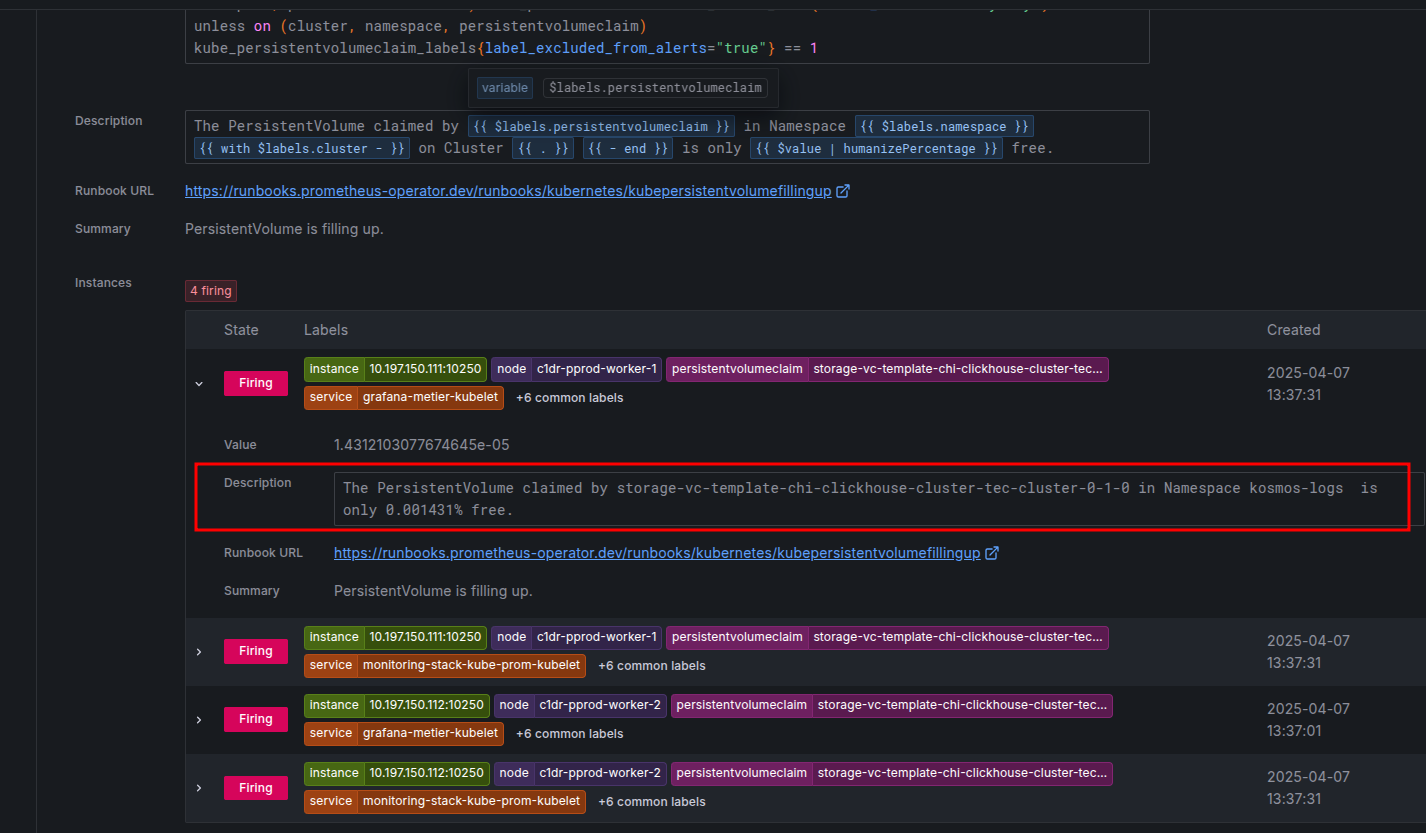
- For each alert rule, you can see the number of occurrences and get more information about each one.
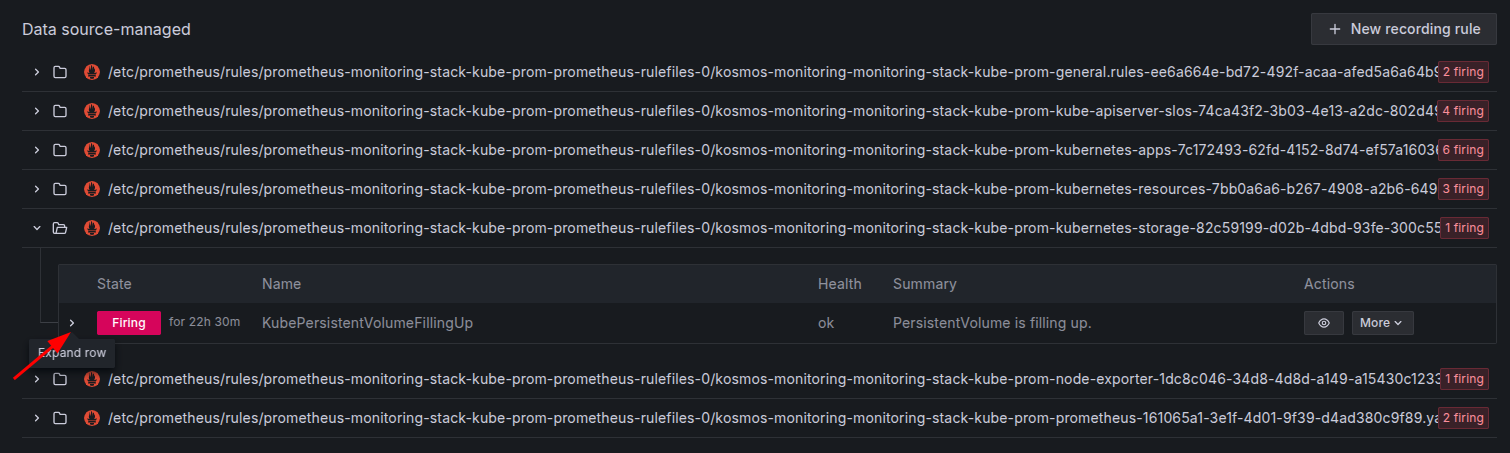
- Example for the rule that checks the usage of persistent volumes:
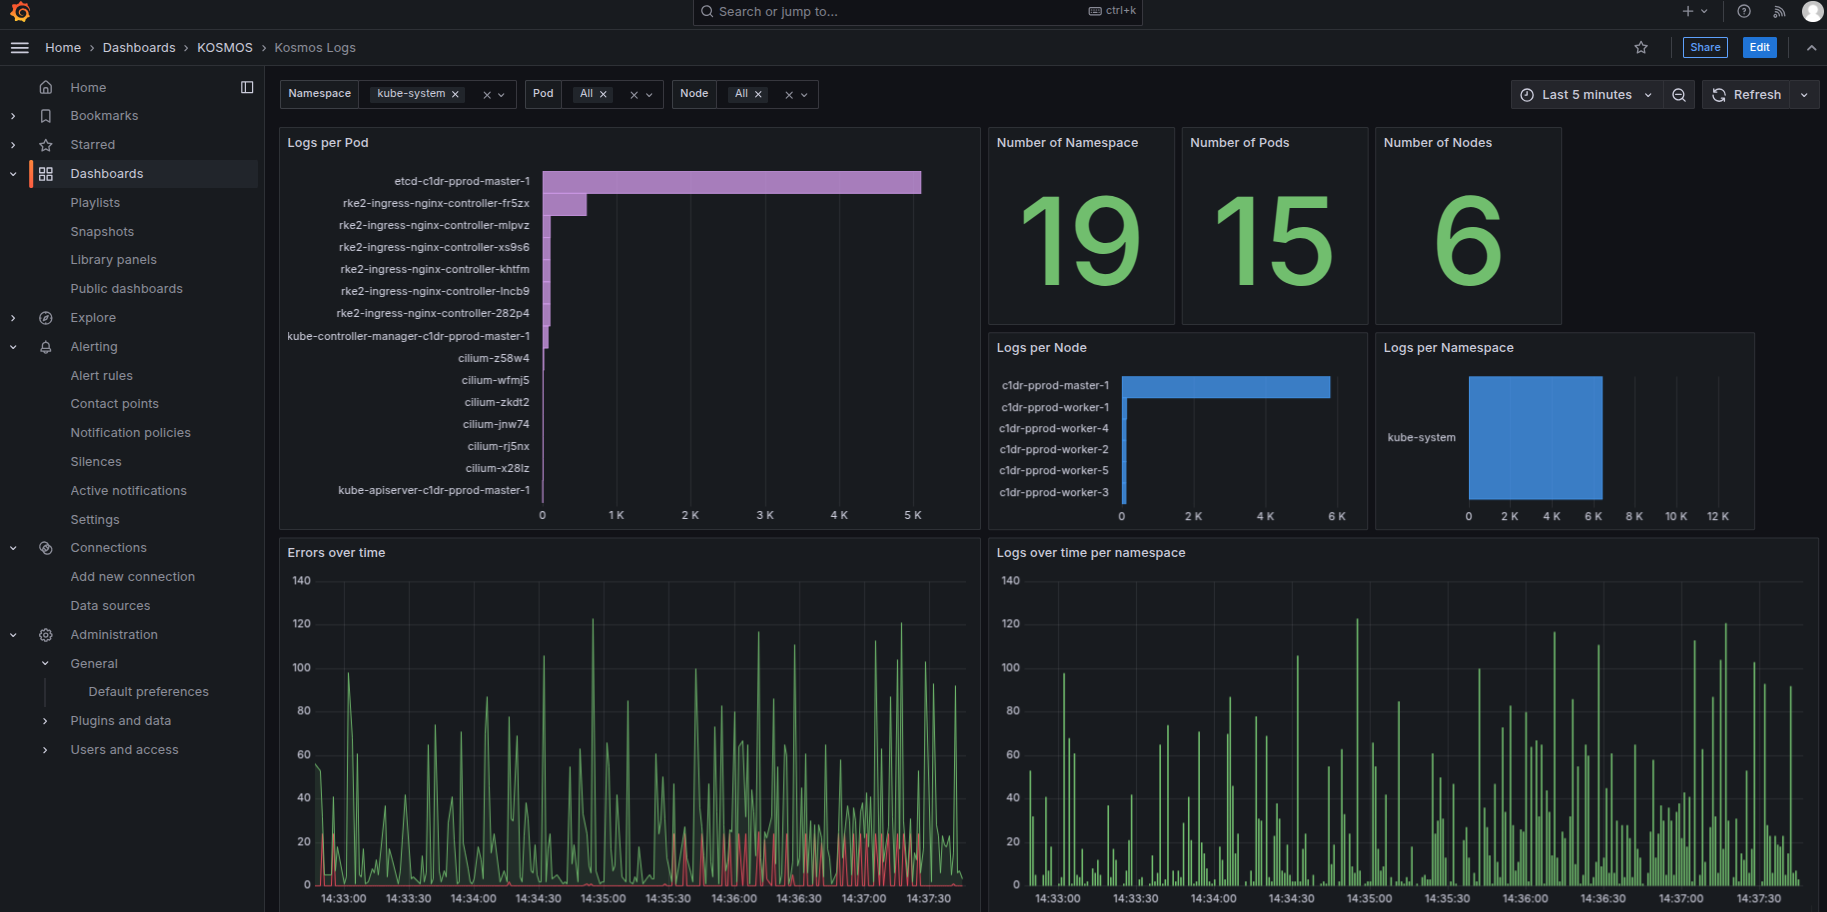
Verify that platform logs are being collected correctly
- Log in to Grafana (tile available from the admin portal)
- Go to Home > Dashboards > KOSMOS > Kosmos Logs
Check the latest Kubernetes cluster events
Security monitoring
Audit dashboards
A set of dashboards is available for the security administrator in Grafana to audit platform usage:
- Keycloak administration
- PostgreSQL administration
- Keycloak authentication audit
- Clickhouse audit
- Datapipeline audit
- EdS audit
- GDA audit
- GitLab audit
- Login audit Jupyterhub
- Minio audit
- Audit Network Policy
- OpenSearch audit
- SAP audit
- SAS audit
- vStore audit
- Postgres authentication